
The demo analytics is an interactive dashboard allowing users to view detailed analytics and statistics for their demo orders. This dashboard is comprised of useful charts, graphs, and other data filtered by specific time ranges (as shown below). To access the Demo club analytics page, go to Services > Demo Clubs > Analytics.
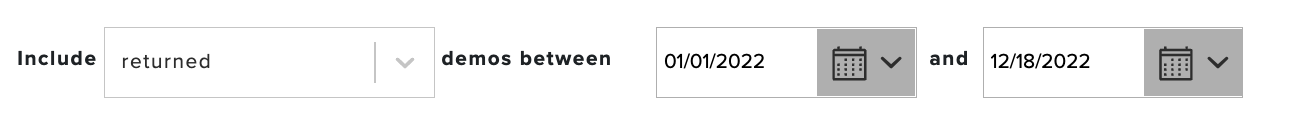
Use the filter to update the dashboard to include demo orders by status (e.g., returned, issue) and date range (as shown below).
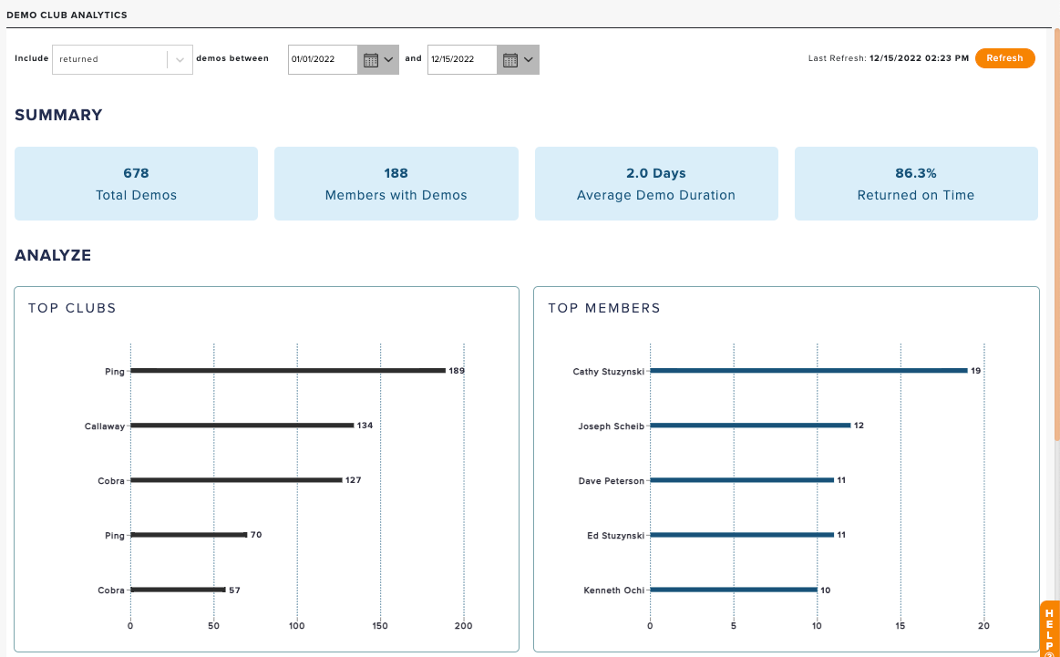
The dashboard will provide details in tiles for the following content:
Summary (including Golf Shop Customer Average):
# Demos
# of members who checked out a demo
Average Demo Duration
% Returned on Time
Top Clubs:
Most demoed clubs by brand
Top Members:
Members who had the most demos
Demo Result:
Returned, sold, never returned, and generated special orders
Demo Volume Trend:
# of demos checked out
Data points by week
Component vs. Full:
% demos with components vs. % demos with full clubs
Club Details Analyzer:
Drill down demo volume by specs (e.g., loft, like, make), identifying the demand for certain types of specs which will allow you to optimize inventory selection.
Select a club custom field (spec) to generate a chart