
Rental analytics is an interactive dashboard that allows managers to view detailed analytics and statistics for their rentals. This dashboard comprises useful charts, graphs, and other data filtered by specific time ranges (as shown below). Go to Services > Rentals > Analytics to access the Rentals analytics page.
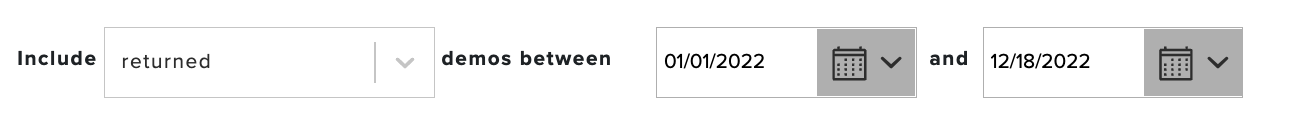
Use the filter to update the dashboard, including rentals by status (e.g., returned, issue) and date range (as shown below).
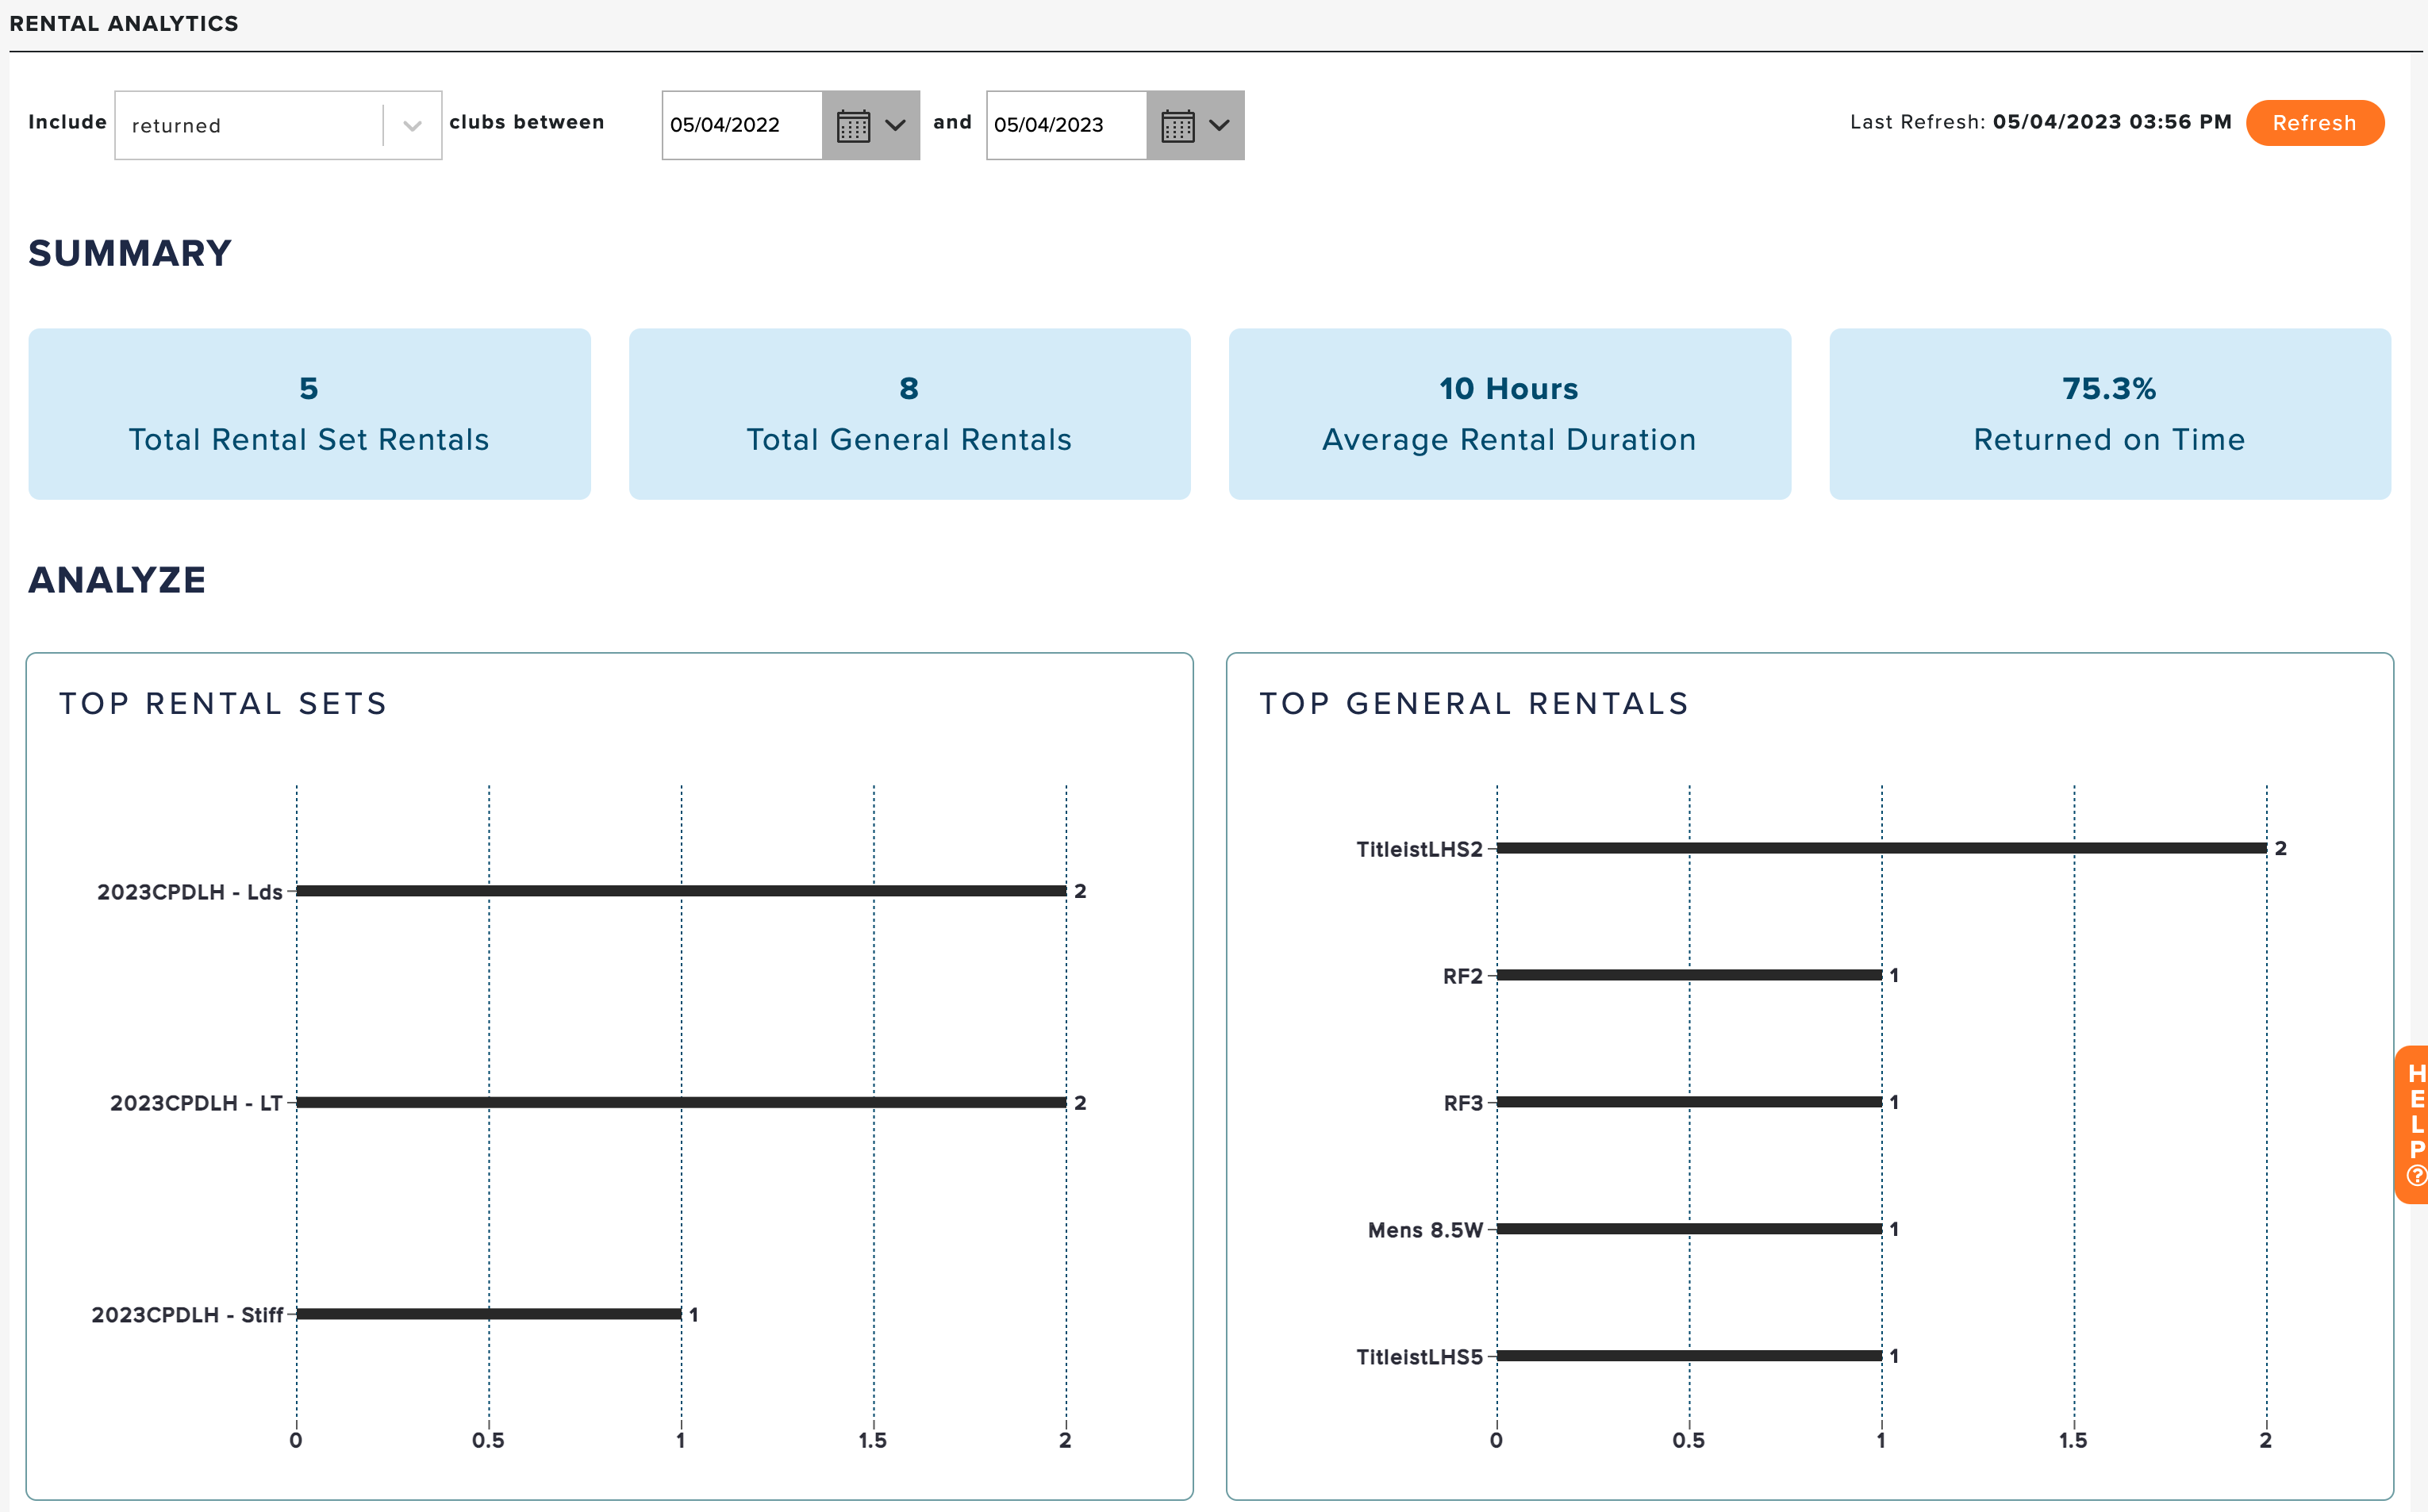
The dashboard will provide details in tiles for the following content:
Summary:
Total Rental Set Rentals
Total General Rentals
Average Rental Duration
% Returned on Time
Top Rental Sets:
Most rented rental set.
Top General Rentals:
Most rented general rentals. Note: General Rentals include all rental types except for Rental Sets.
Set Flex:
Drill down rental set rentals by set flex.
Right or Left Hand:
Drill down rental set rentals by dexterity
Rental Trend:
This timeline shows the peaks and valleys of rentals throughout the season.