
This feature is available for the following products:

Our system has a variety of reports available to you. However, some reports may not quite give you precisely the look and/or content you desire. The Report Composer, similar to the Page Composer, offers extensive customization in building reports that fit your needs.
What's the difference between the Page Composer and Report Composer? Click Here for an explanation.
In this article, we will discuss how to create and manage reports using the Report Composer. If you'd like to get a more detailed and thorough look at the Report Composer, check out our webinar schedule to sign up for our recurring Report Composer webinar.
Report Initial Setup:
To create new reports using the Report Composer, go to Rounds > Report Center > New Document > New Report.
Enter or select the following:
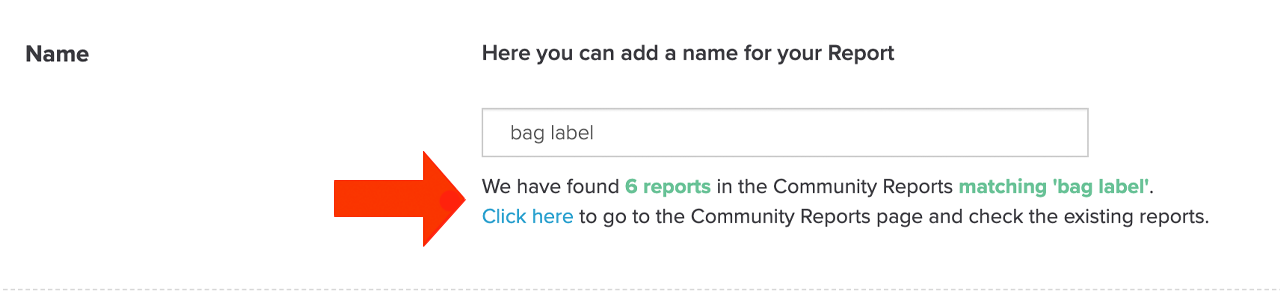
Name: Name the report.
In the event the name you entered matches a document in the Community Reports, the system will identify reports with matching fields based on name, category, and tags. When a matching document is found, the number of reports and a link to the community reports will be provided for quick access (as shown below).
Layout: Select the layout to be used for the report. The layout defines the paper size, number of columns, header heights, footer heights, margins, and more. Creating a new layout is discussed later in this article.
Report Center: Select the Report Center categories to include the report.
See the example below as we enter the setup for a condensed alpha list.
Click "Save."
Report Structure:
After saving, you can view and organize the structure of the report (as shown below). The structure of the report determines the content to include in the report itself. Every report has a hierarchy:
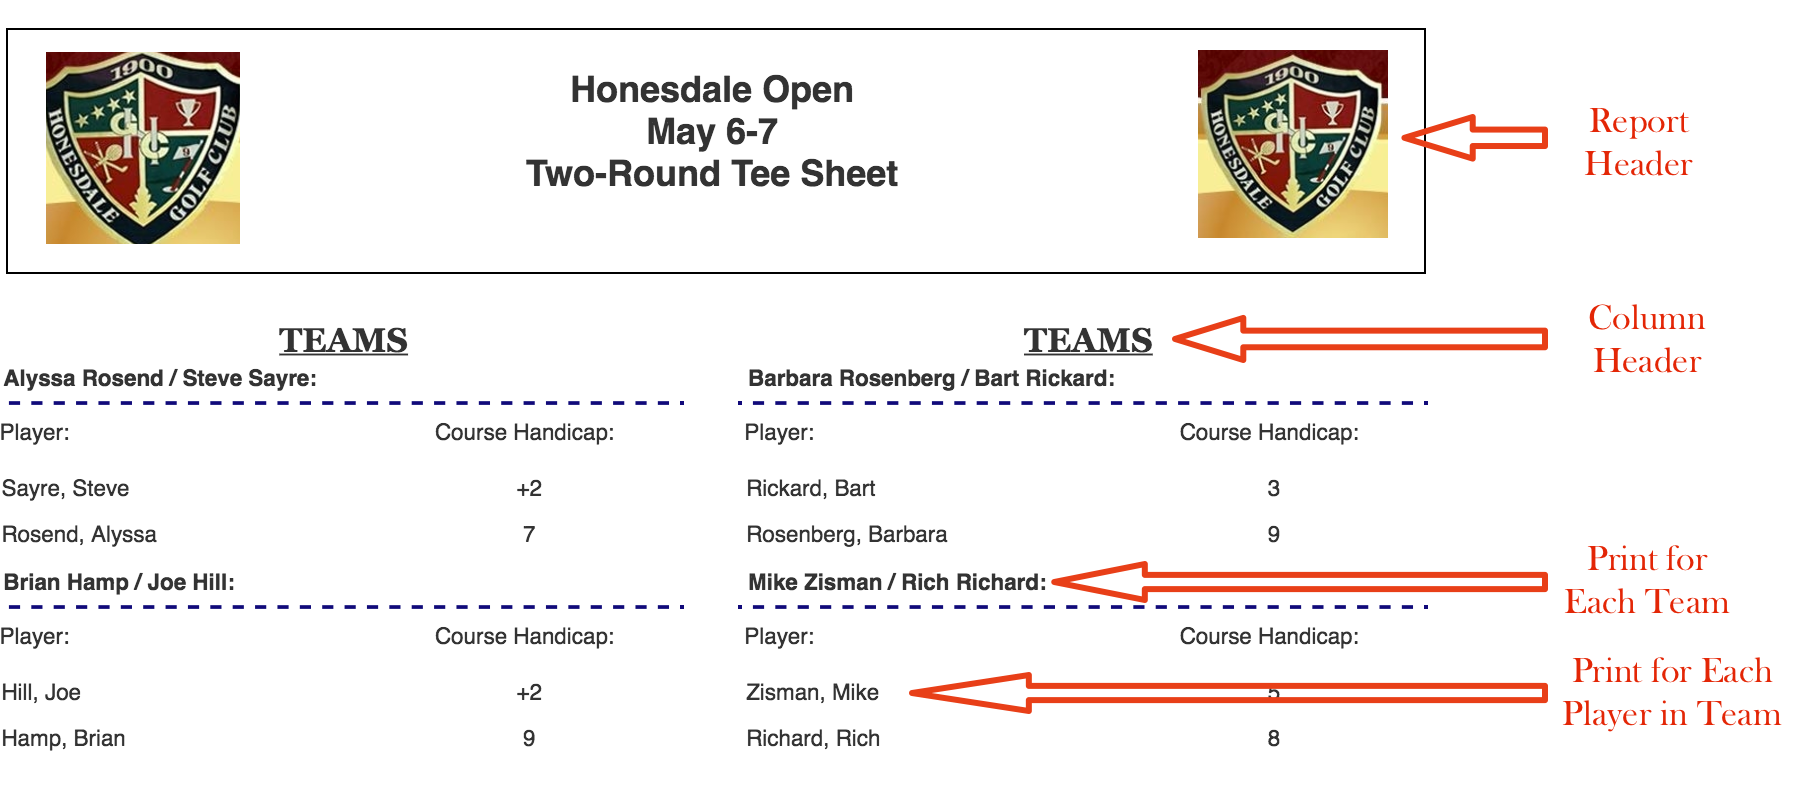
Report Header: At the top of the Hierarchy is the report header. This section will typically include the report name, club name, primary and secondary logos, etc. The Report Header will only appear on the first page of the report.
Page Header: Just below the Report Header will appear the page header. This section will typically include the report name. The Page Header will appear on every page of the report.
Column Header: A column header may or may not be necessary, but it will be advantageous if you are creating a report that is sorted, for example, by division, flights, or teams. Further, you can define individual column headers for reports with multiple columns. For more details about multiple column headers, Click Here.
"New Content Area": This is the "body" of the report where players, teams, courses, dynamic fields, and much more are listed. The body of the report can be drilled down to different structural levels depending on your needs.
Page Footer: The page footer will be seen on each page of the report. If you would like to add a page number, print date/time, those can be added to this section.
Report Footer: The report footer can be used to finish the report off as it will only be seen on the last page of the report. If you would like to add any additional footnotes or final report notes, this will be the ideal location.

Please look at the report below; we see each structure level due to the previous image's structural setup. Specifically, this report is sorted into two columns by teams using detailed information from each player in the team.
New Content Area Control:
As the "body" of the report, this area can be drilled down to different content levels depending on your needs. As you build the body of your report, you will be able to pick and confirm each content level (as shown below). Pick the level using the dropdown selector and confirm your selection by clicking the blue checkmark.
After confirming the selection it will be saved (as shown below). If you need to edit the selection, click the gear icon and you will be able to edit that content level.
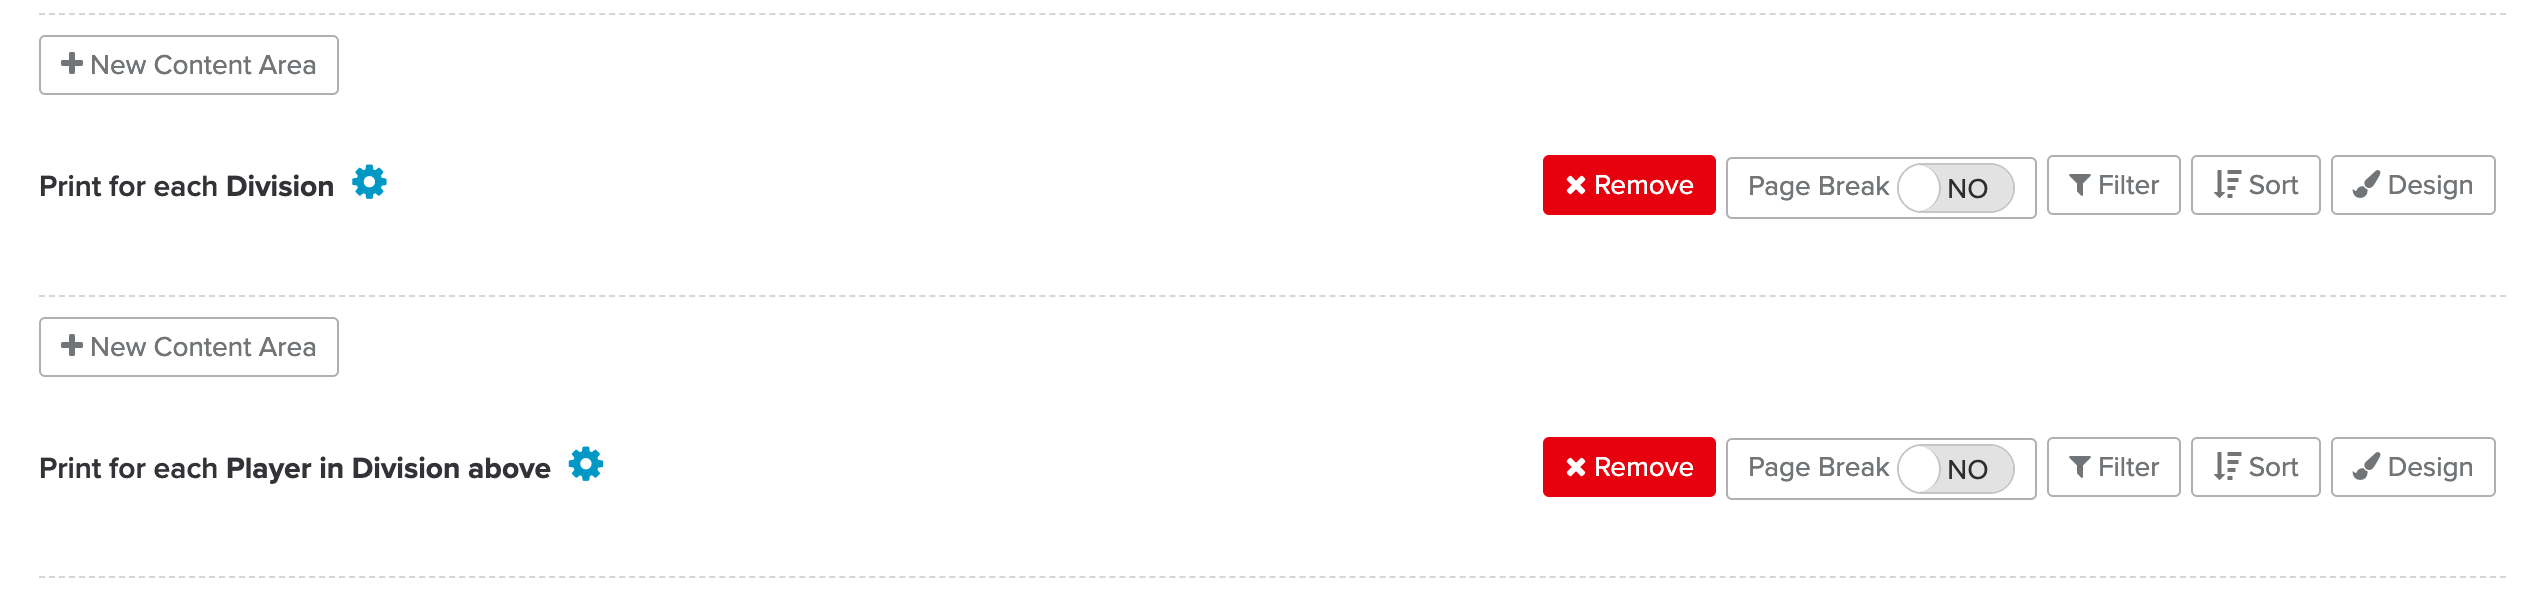
There are multiple content levels that can be used depending on the needs of your report. For example, if you would like a report for each player in your division, your highest content level will be division and the lowest content level will be players (as shown below).
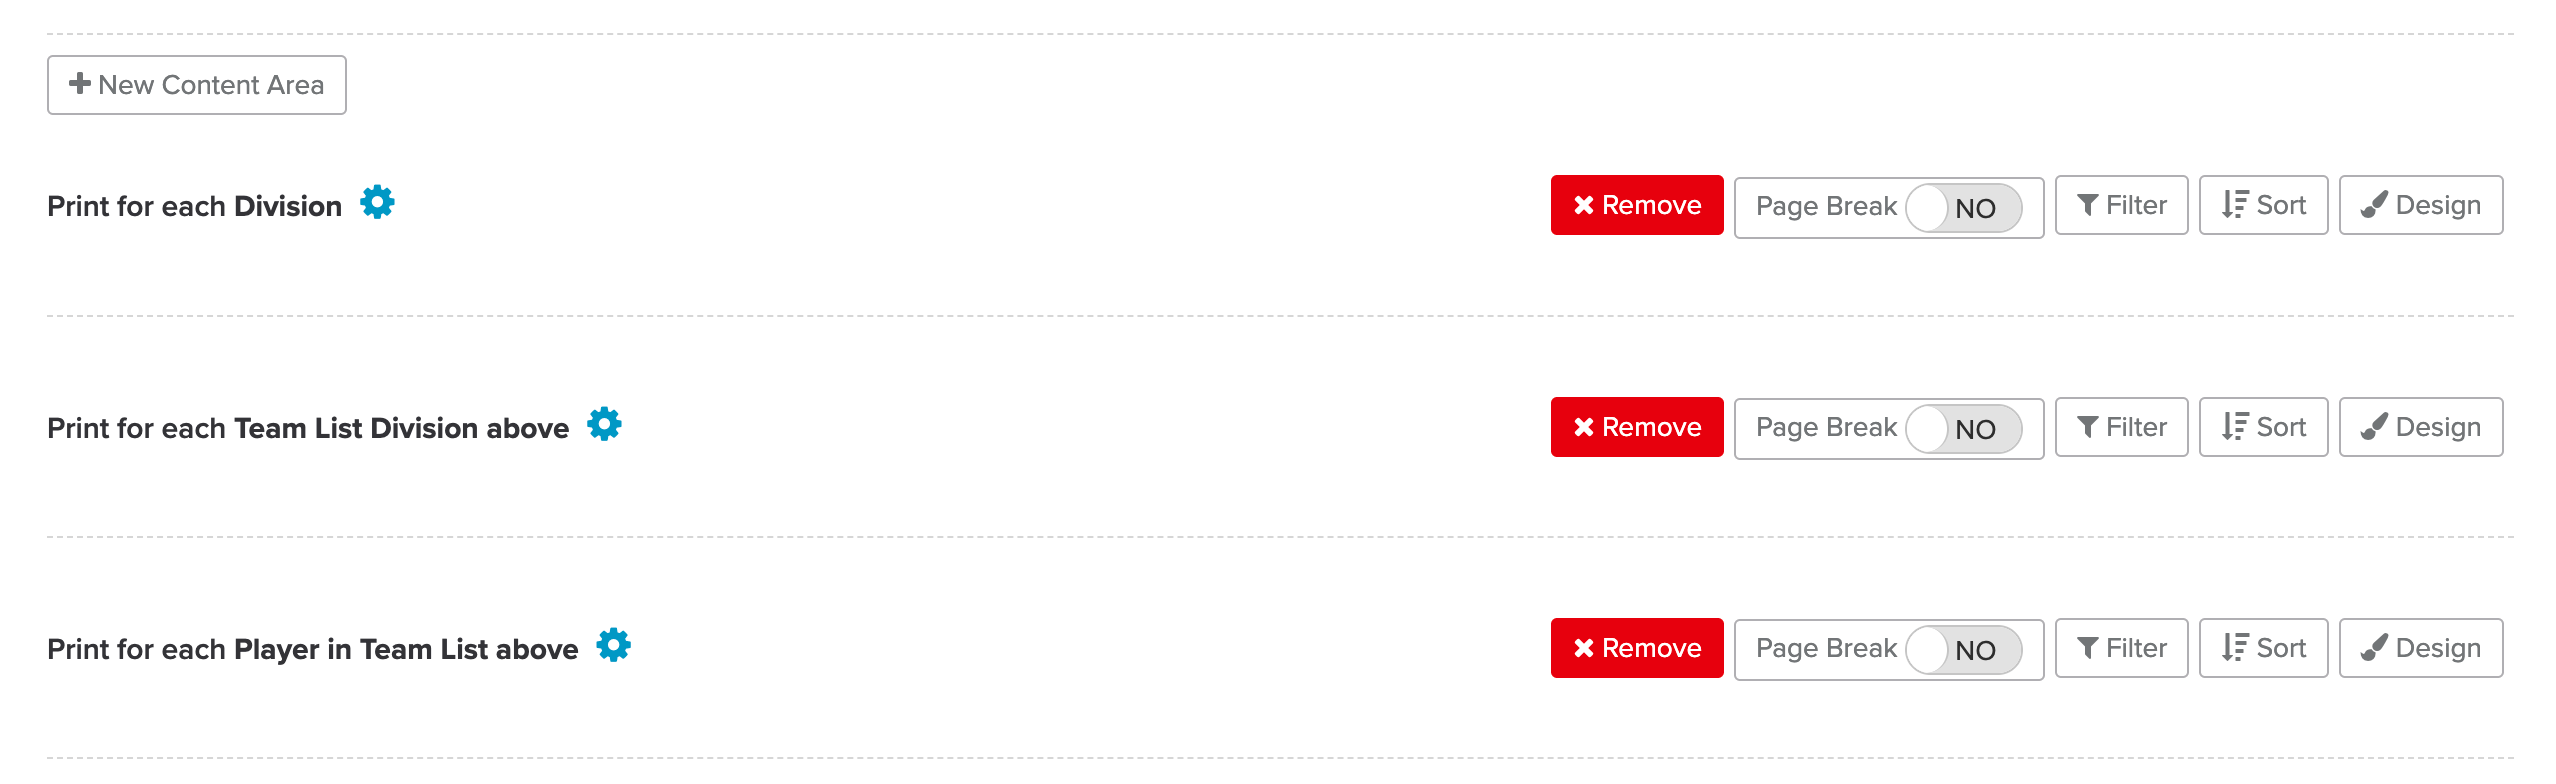
If you have chosen content areas that can have a level above or below it, you will be able to add that content structure level while maintaining the existing hierarchy of your report. For example, in the structure levels shown above, I also want the players grouped into their teams within the division. By selecting the "New Content Area" above players, and choosing the new content level, the report will now include each team within a division (as shown below).
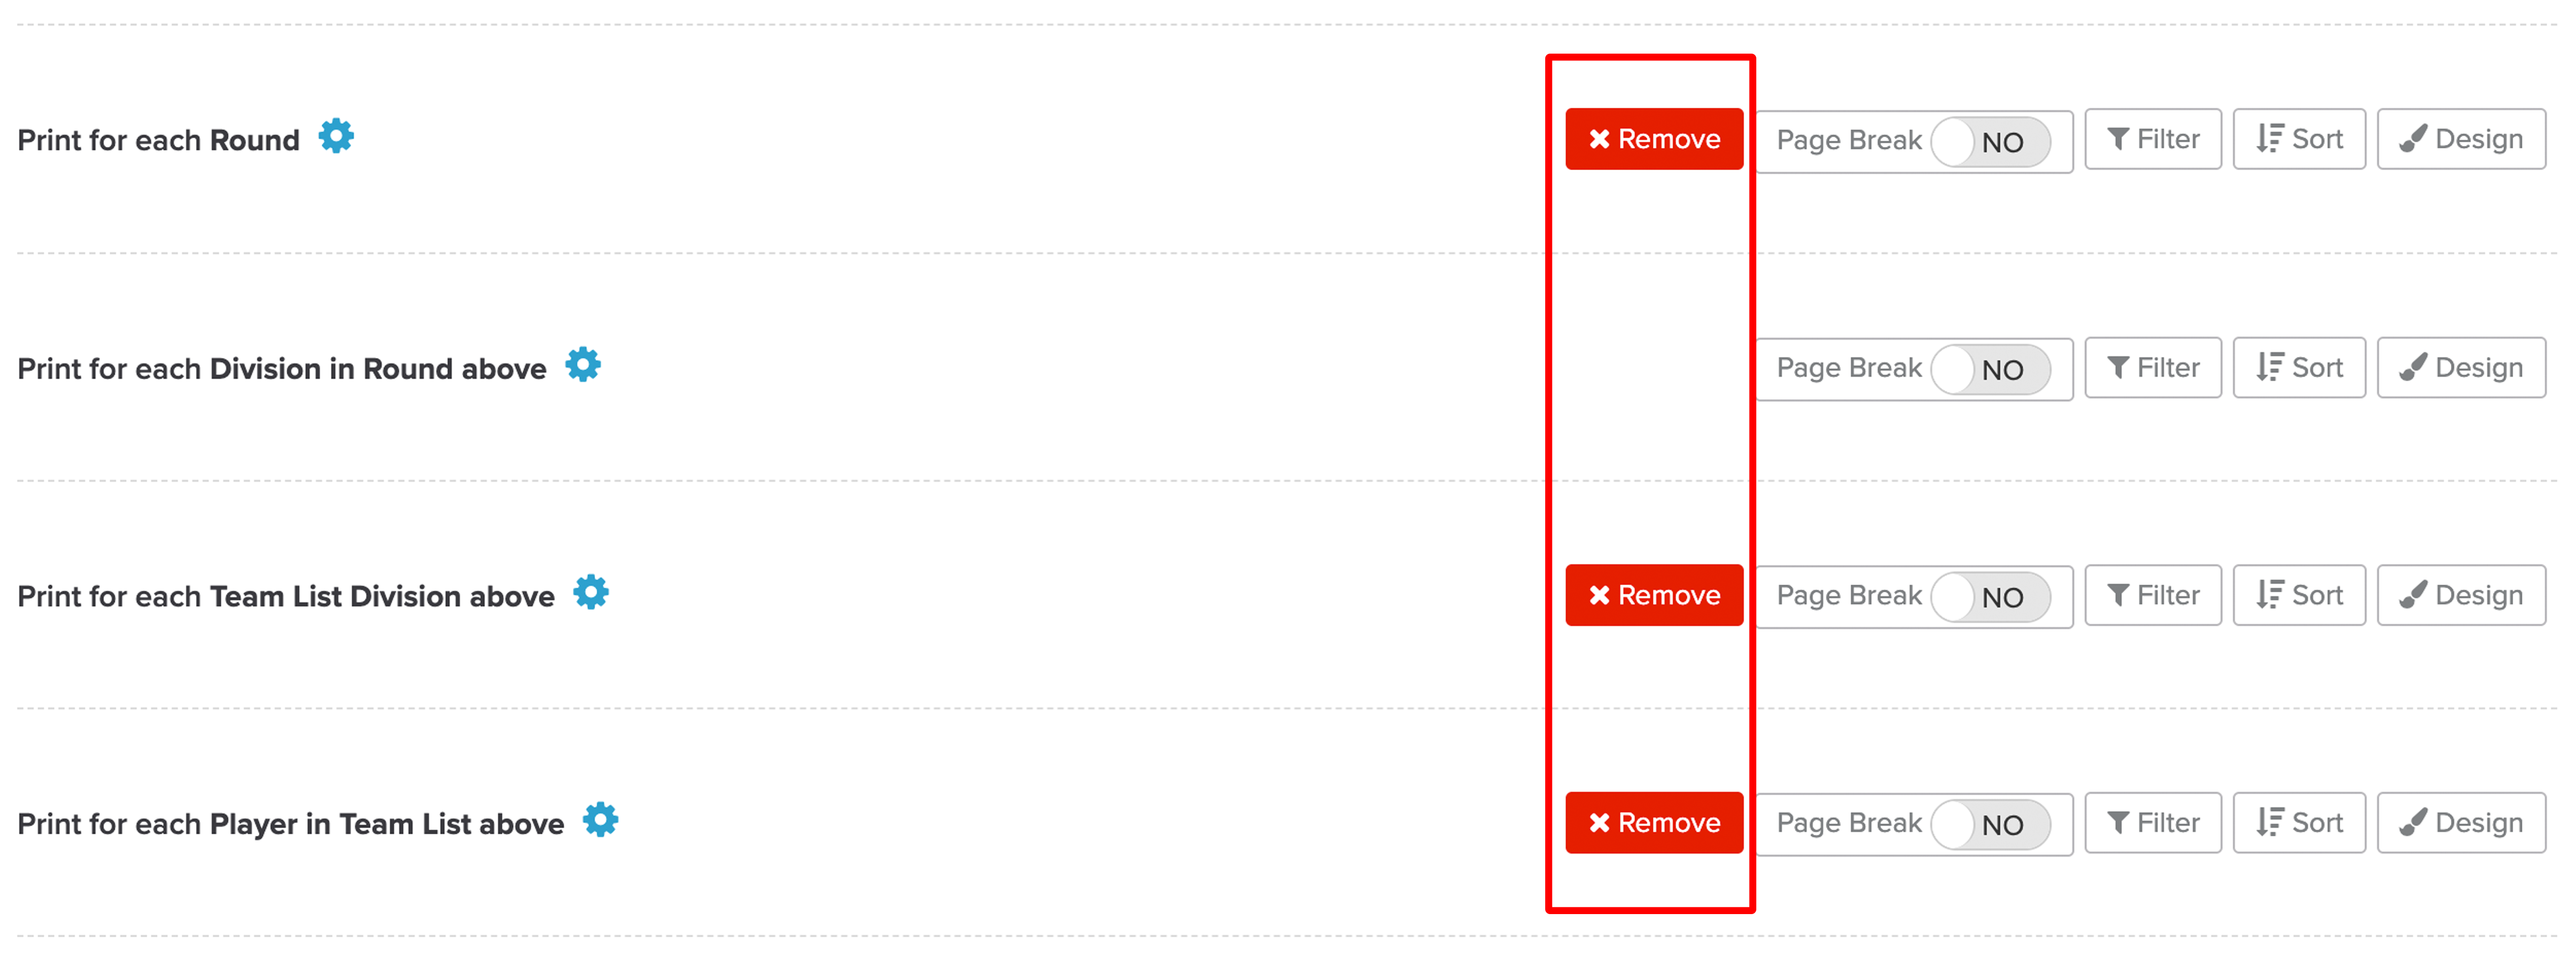
As you create your content levels, you may also need to remove a content level. To remove a content level, click the red "Remove" button for that content level. If the removal of a content level will impact the structure of the content levels, the "Remove" button will not be available (as shown below).
Structure Level Controls:
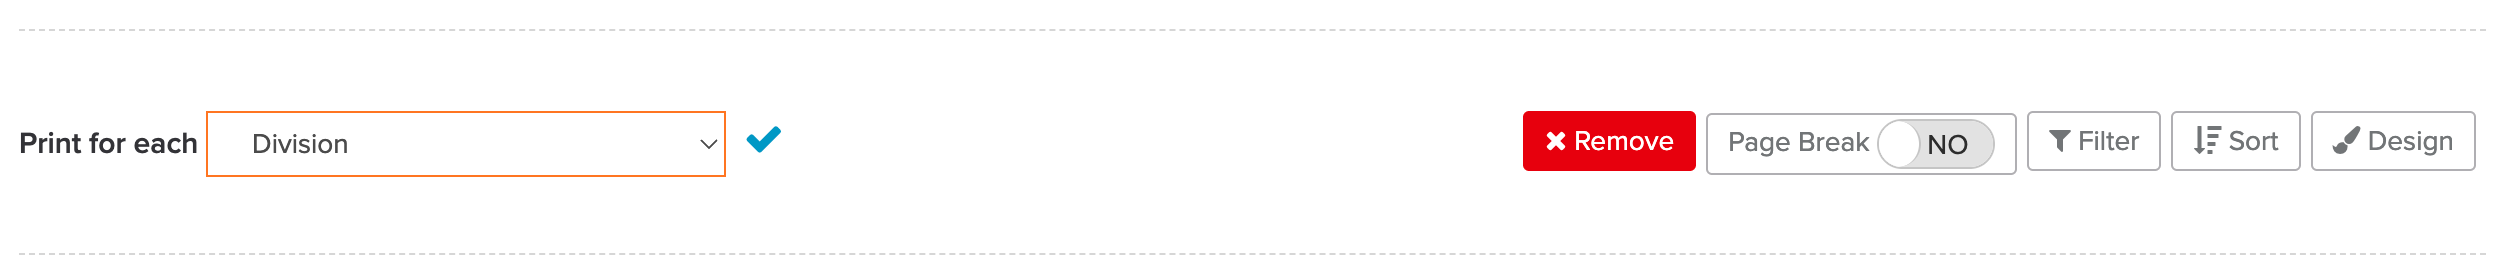
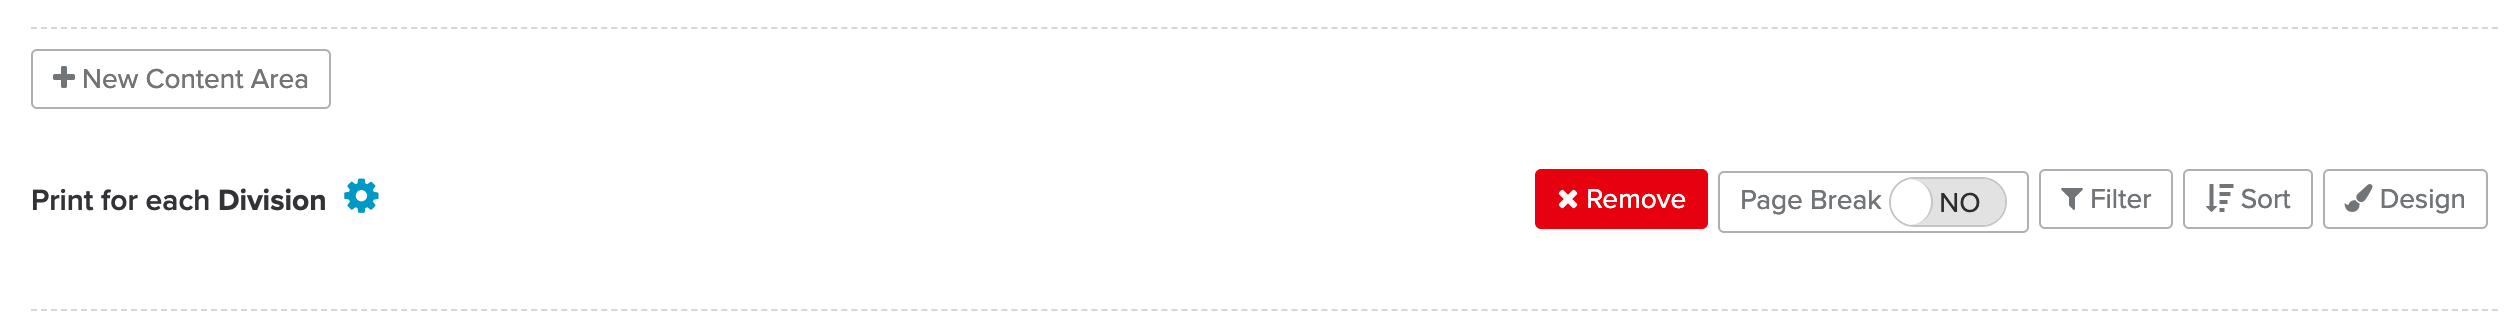
There are actions (e.g., Sort, Filter Design, etc.) that can be taken for each structure level (as shown below).
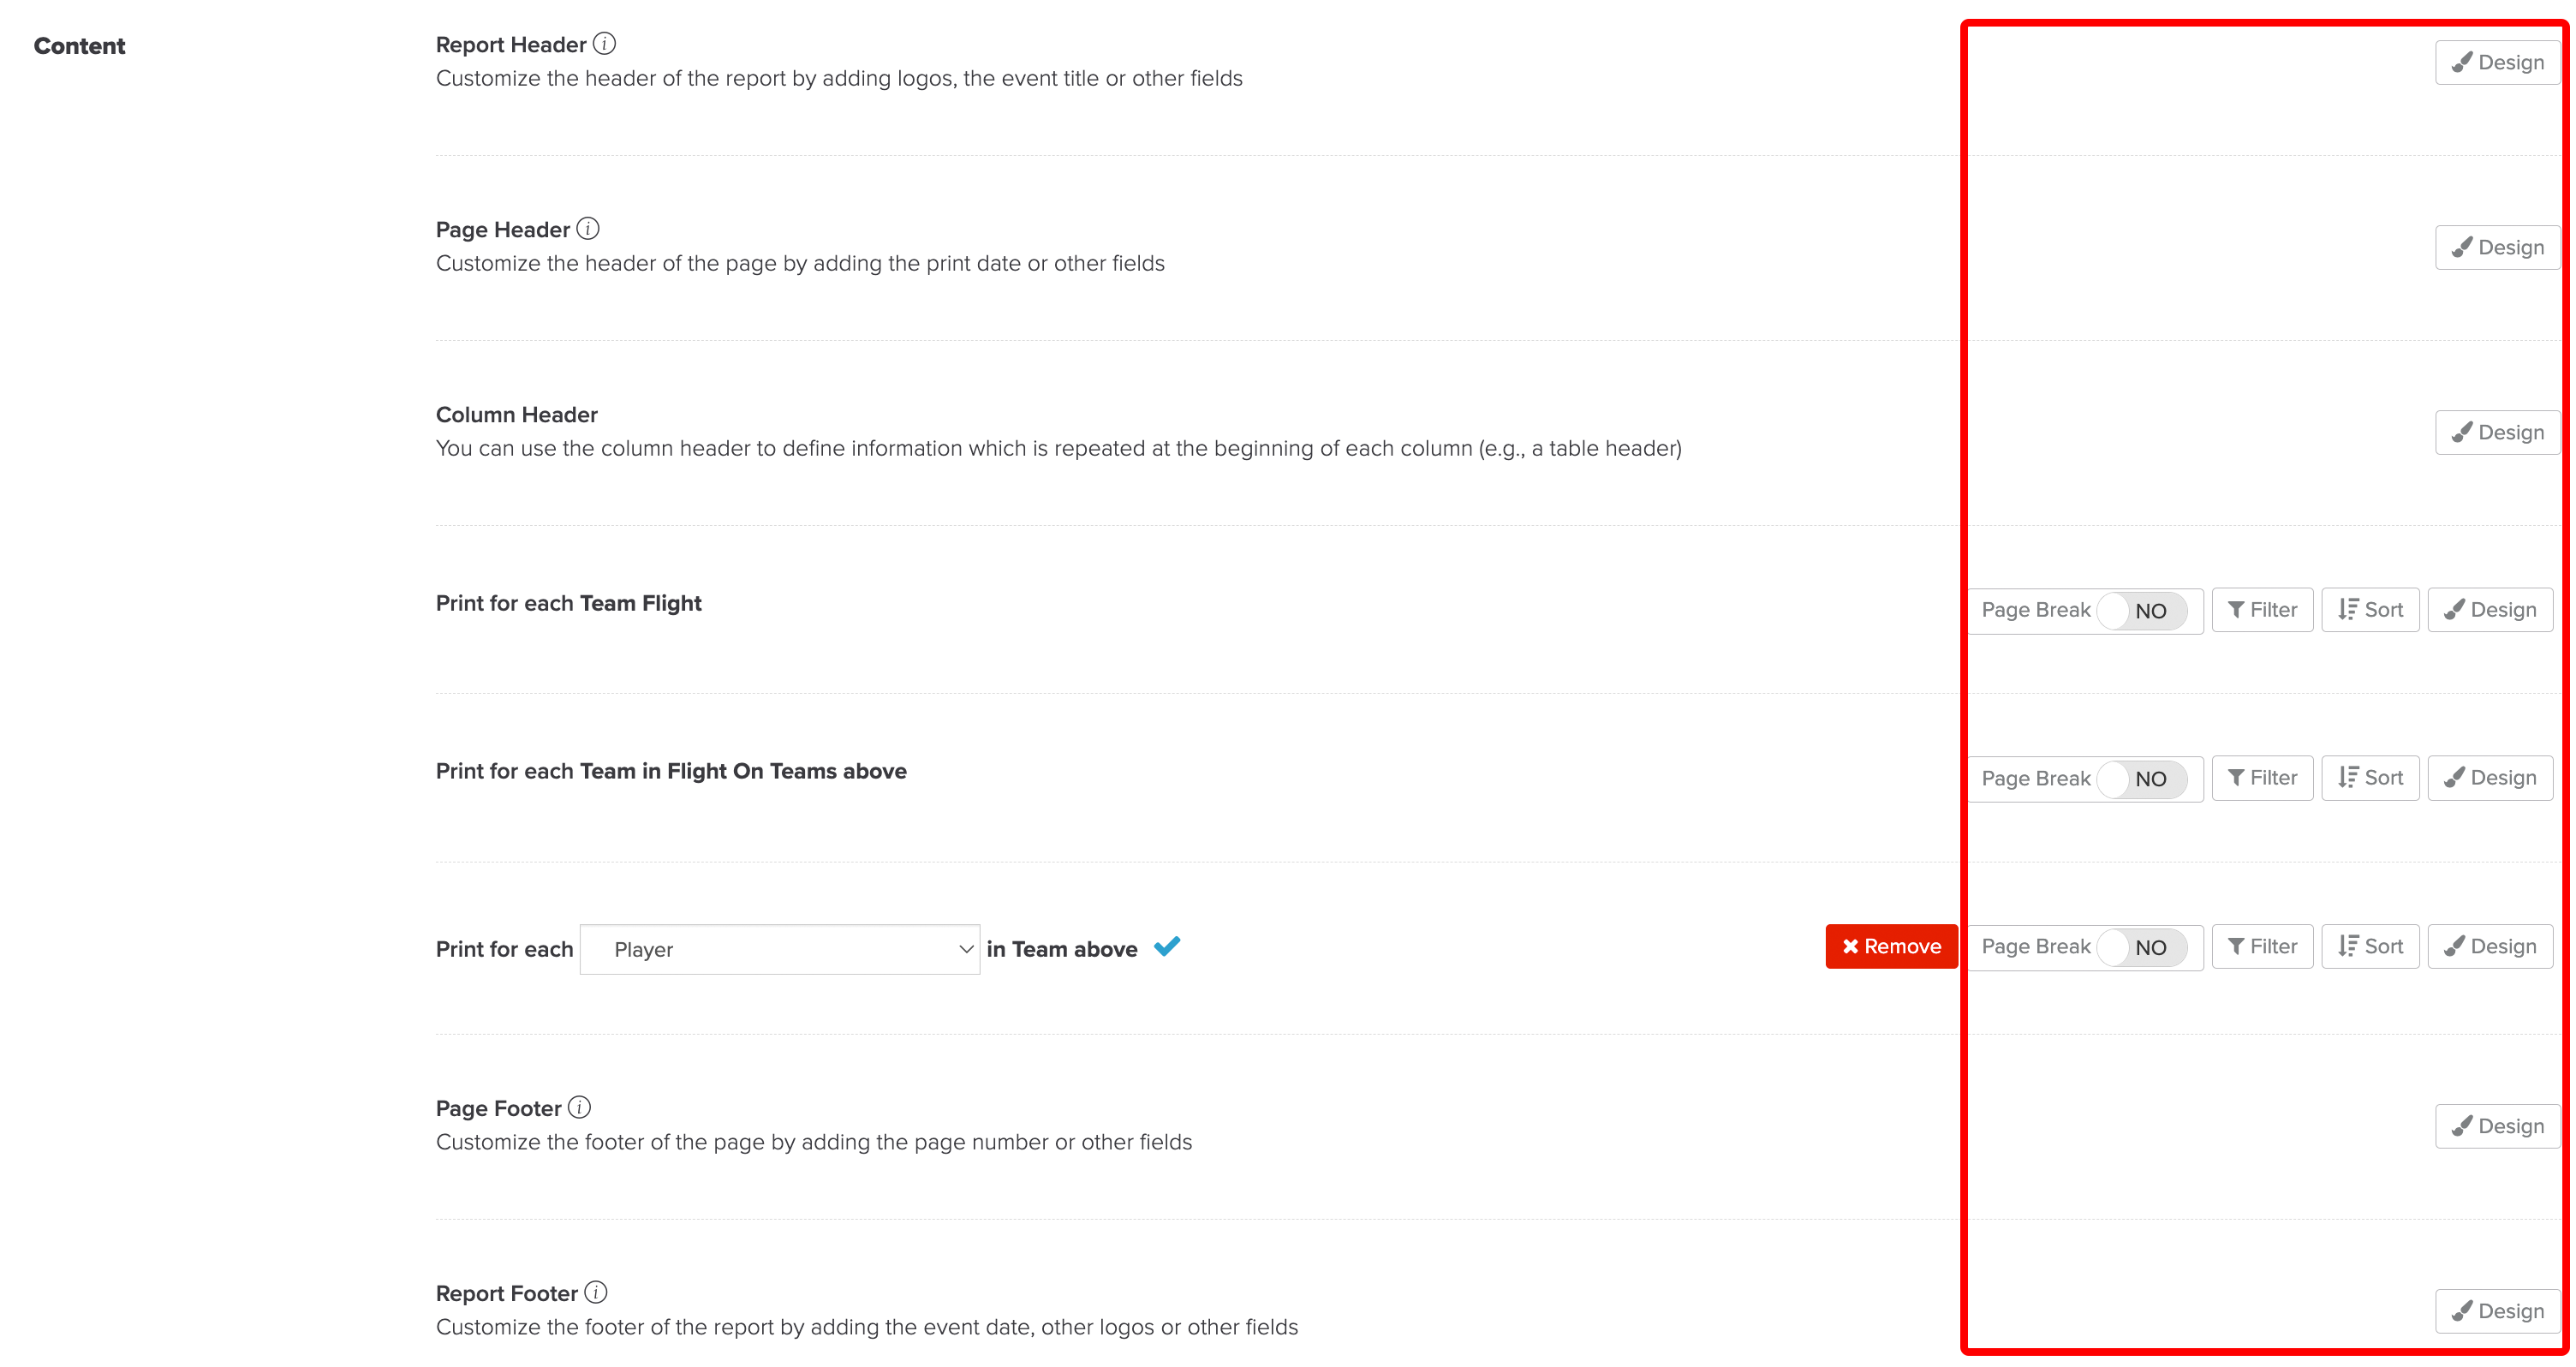
Page Break (Single Column Report): You can enforce page breaks to separate information by creating a report with only a single column. For instance, if you create a flights report, a page break can be made after every flight. For more details on page breaks, Click Here.
Page Control (Mulitple Column Report): If creating a report with multiple columns, you can enforce page breaks and column breaks to separate information. For more details on page and column breaks, Click Here.
Filter: If you do not want to print for every flight, team, player, etc., you can filter what is displayed on the report. For more details on filtering, Click Here.
Sort: How would you like the flight, team, player, etc., sorted on the report? Some examples would be sorting an alpha list alphabetically, sorting teams within a flight by total team index, or sorting gift certificates by finishing position in the tournament. For more details on sorting, Click Here.
Design: What information will be displayed at this structural level, and how will it be displayed? This is discussed more later in the article.
When creating a report with the first structure level set to print for each "Player" (as shown below), there will be an option to group by either:
No Grouping or
Last Name Initial.

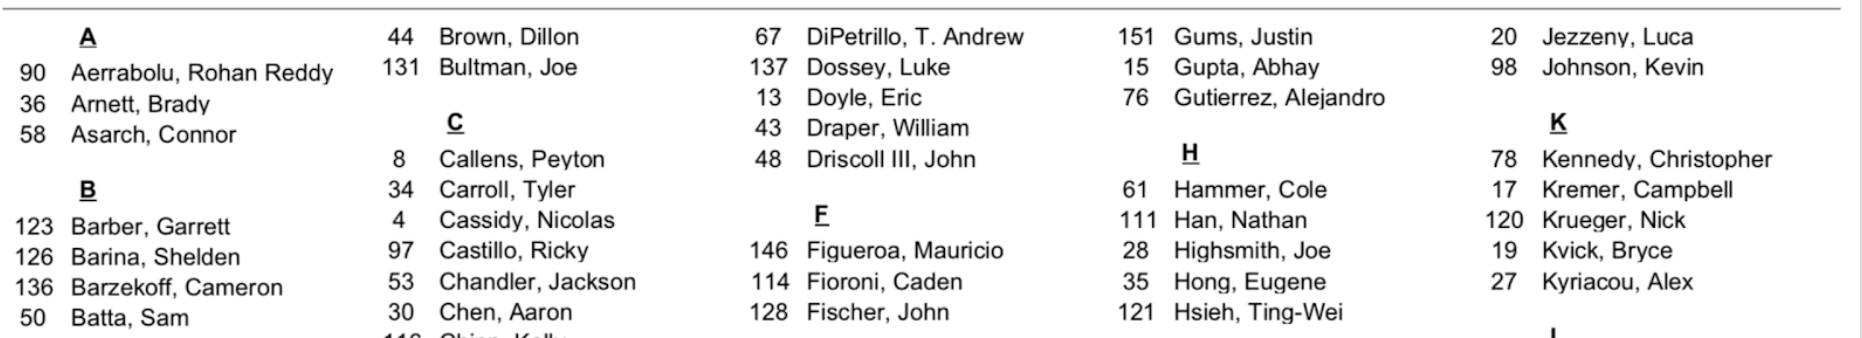
When selecting "Last Name Initial," the player list will be separated by last name initials. This is popular for alpha lists (as shown below).
Designing the Structure Levels Content:
To design the content within a structural level of the report, click "Design." For some composer tips and shortcuts, Click Here.
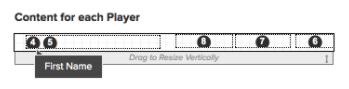
In the report below, we are currently designing the content for each "Player."
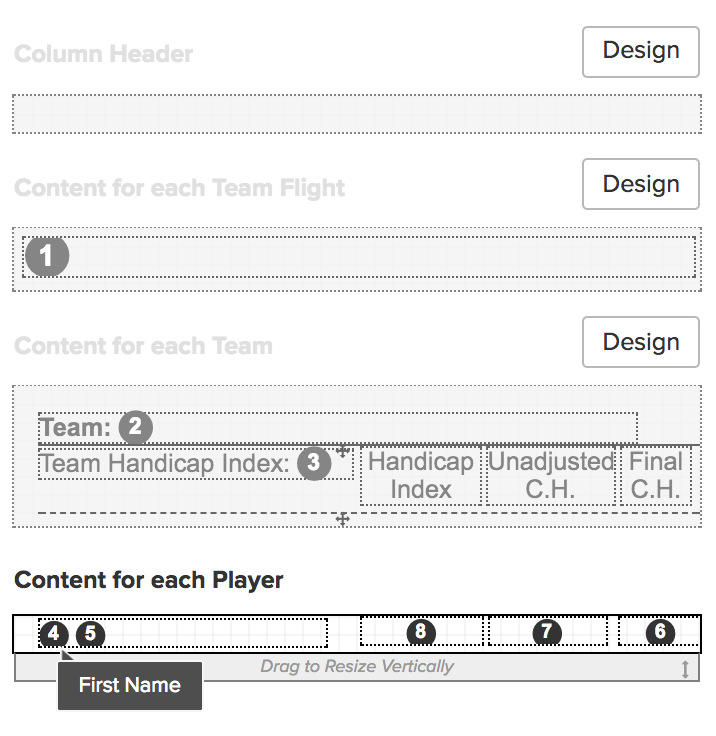
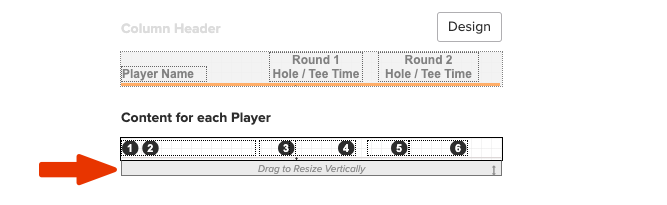
You can click and drag the gray area (as shown below) to increase or decrease the vertical space.
Clicking on "Design" in another structural level will move you to the "design" area for that level of the report.
The numbers listed in the content are placeholders for the actual content that will be displayed. To view what content will be displayed, hover over the placeholder (as shown below).
Clicking on the text or placeholder will open up the text editor (as shown below). When in the text editor, you can add new text and other content by typing it into the text editor (on the left as shown below) and data fields by clicking the data field you wish to enter (on the right as shown below).
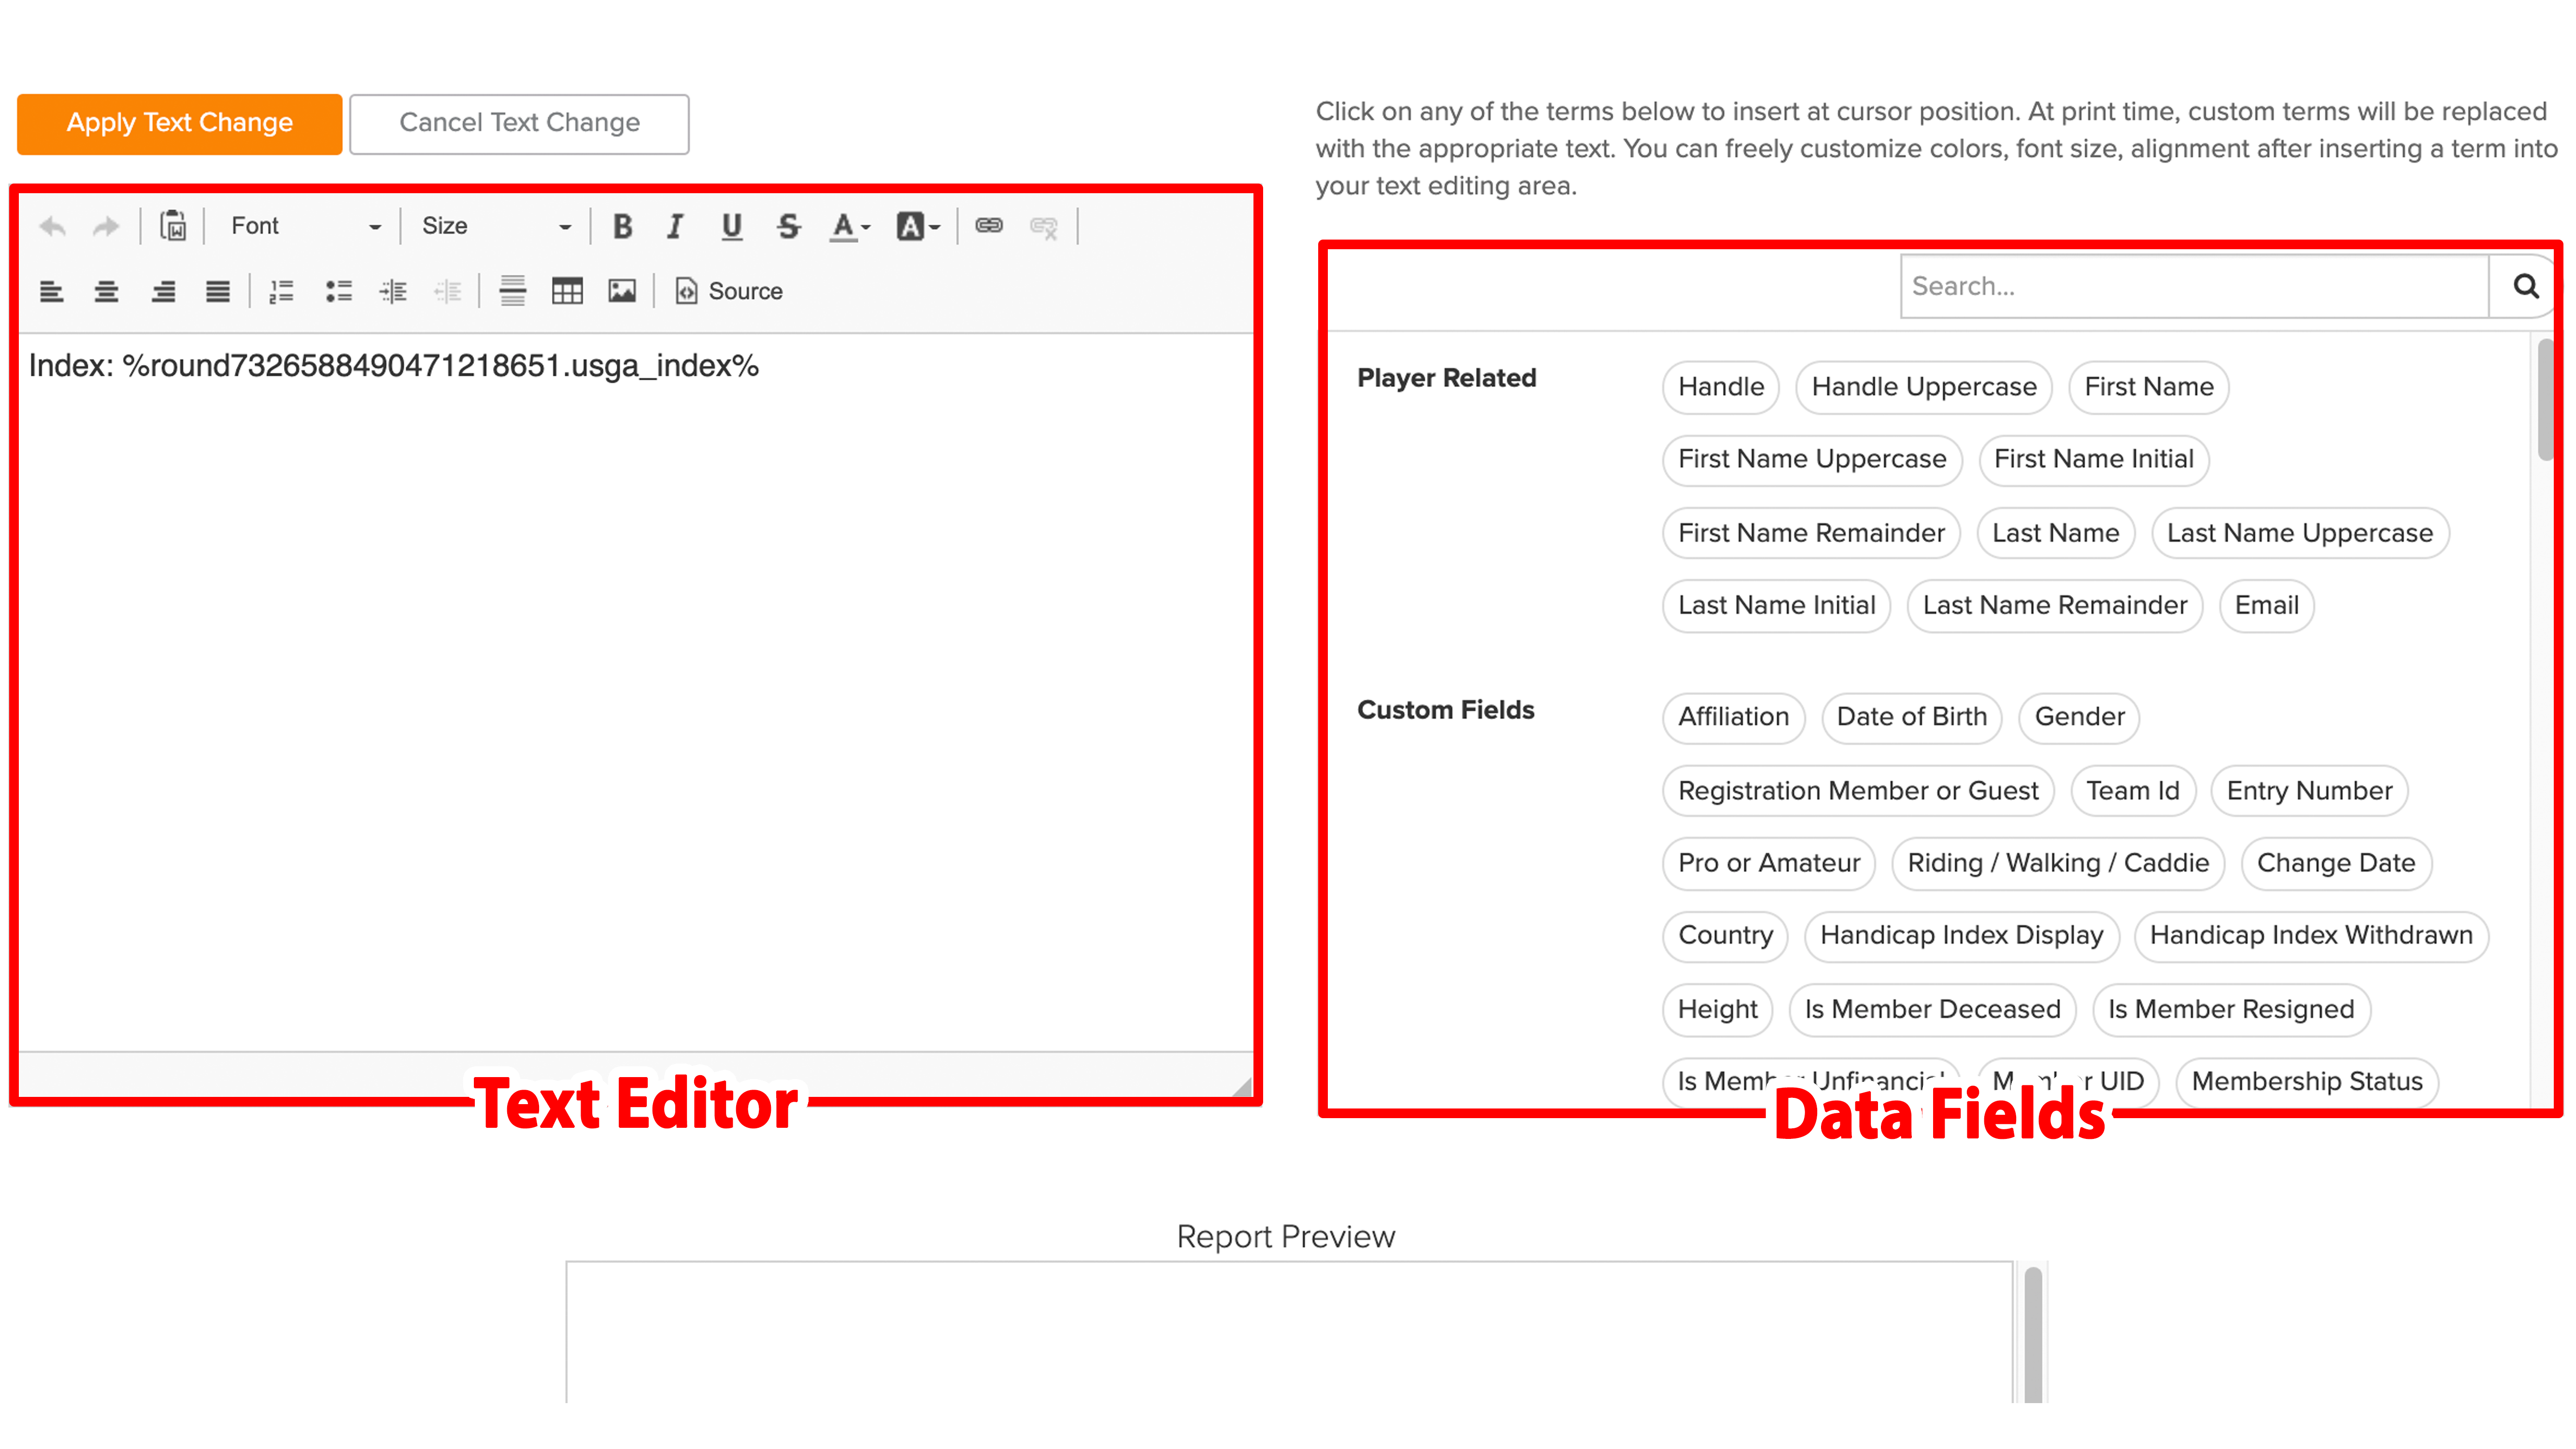
Text Editor: In the text editor, you can enter text and adjust the text (e.g., color, font size, underline, indent, etc.). You can also include dynamic data fields in the text. The text "Index:" is entered in the example above, followed by the player Handicap Index data field. By adding the data field, every player's Handicap Index will be listed.
In addition to adding and editing text, there are other tools available on the left. Note: Not all tool are available at all structure levels.Primary Header: Adds your custom report header to the design area.
Golf Hub QR Code: Adds a scanable QR Code for the event/league Golf Hub Page to the design area.
Primary Logo: Adds your clubs primary logo to the design area.
Secondary Logo: Adds your clubs secondary logo to the design area.
Photo From Album: Add a photo from your photo gallery to the design area.
Upload Photo: Add a photo from your computer to the design area.
Add Rectangle: Create a rectangle of any size and change the color, border width, and more. Simply click and drag the corners to re-size. For more info on adding a rectangle, Click Here.
Add Line: Add a line of any length, width, and color. Additionally, you can change the angle if needed. For more info on adding a line, Click Here.
Send to Back and Send to Front: Images, rectangles, lines, and text boxes may overlap at some point. By clicking on any of them, you can send one or the other to the back. For instance, maybe you have a watermarked image created. It would be a good idea to send that to the back.
Duplicate: Add a duplicate of any image, rectangle, line, or text box. In the sequence above, we duplicated the club logo.
Delete Item: Remove the selected item from the design window. Note: Once deleted and saved, it cannot be recovered. If you accidentally deleted something, but haven't pressed save, click "Cancel" to not save the changes.
Group: If you'd like multiple objects to "act as one" (so they can move together, be sent to the front/back together, etc.), you can group them. Select the objects on the canvas (using "Shift/CMD + Click"), then click "Group." They will be permanently grouped (even after saving). If you'd like to remove the grouping, simply select the objects and click "Ungroup."
Data Fields: Data fields can be included in the text editor. Many types of data fields that can be used, including:
Player Related
Roster Custom Fields
Round Custom Fields
Pairings
Division/flights/teams
Handicap
Tournament
etc.
As you are formatting and editing a report, we suggest you "refresh the preview" below after making changes to ensure everything will be as expected when running the report.
To save the changes made in the text editor, click "Apply Text Change."
Creating New Layouts:
You are asked to select a layout in the initial setup steps of creating a report with Report Composer. The layout defines the paper size, number of columns, report/page header heights, report/page footer heights, margins, and more. In some cases, none of the available layouts may meet your needs. In this case, you will need to design and create a new layout. To do this, go to Rounds > Report Center > New Document > New Report > Manage Layouts > Add New Layout.
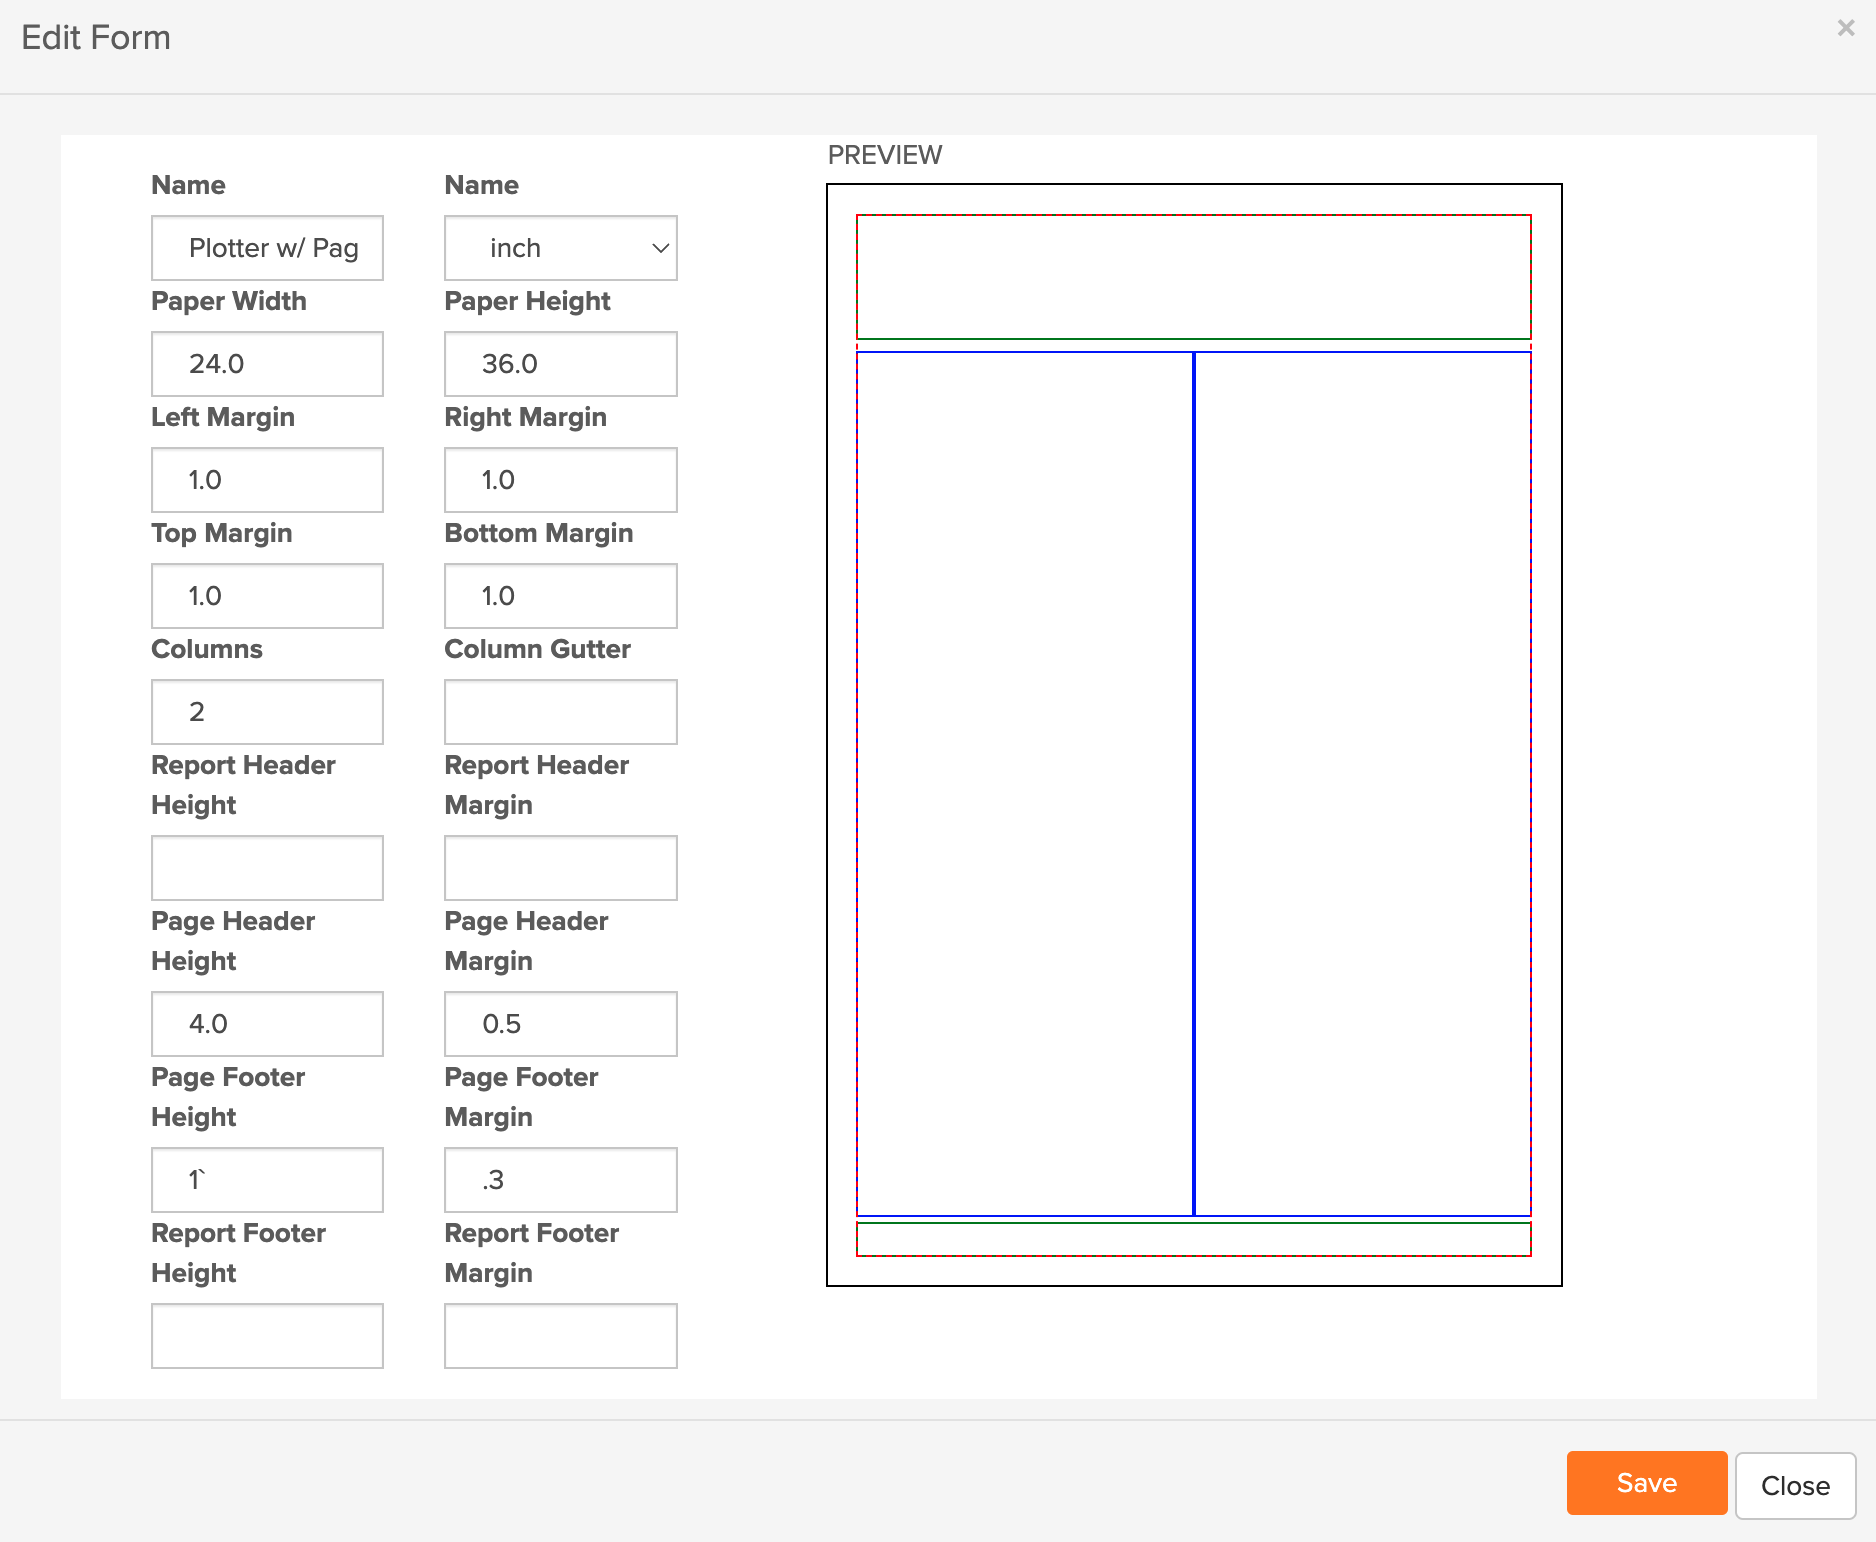
Enter the proper dimensions for your customized layout. In the graphic above, we are creating large format, 2 column report with page headers and footers. After creating a new layout, you can then use that layout in a report.
Report Templates:
You can use the Template option to restrict who can edit the report.
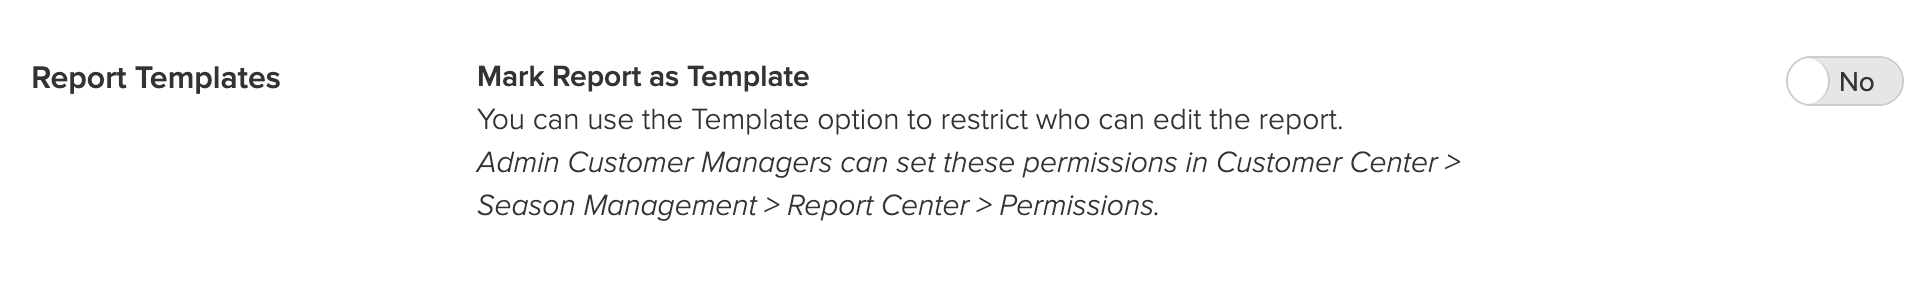
Click "No/Yes" to restrict who can edit the report. For more details on report templates, Click Here.
Sharing Your Report with the Community:
You can also share your report with the user community (as shown below).
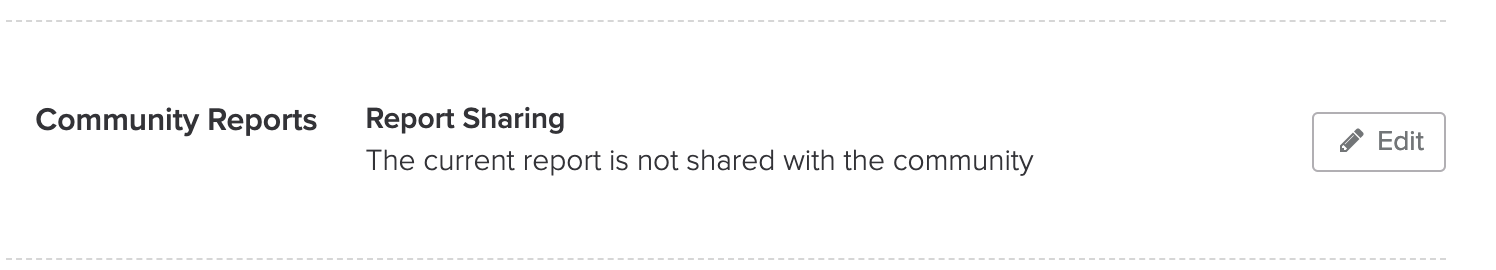
Click "edit" to publish or un-publish your report to the user community. For more details on the publishing to the user community, Click Here.
Configuring the Report:
If you are not creating a new report (e.g., running or copying a report already created), you may need to configure the report to be used for a particular round. To configure the report, go to Round > Report Center, find your report, hover your mouse over it and press "Configure." You will be presented with a new showing you the dynamic fields, what they are used for, and how they are configured. Additionally, the preview, display where the data will change on the report as you hover over the dynamic field you are adjusting (as shown below).
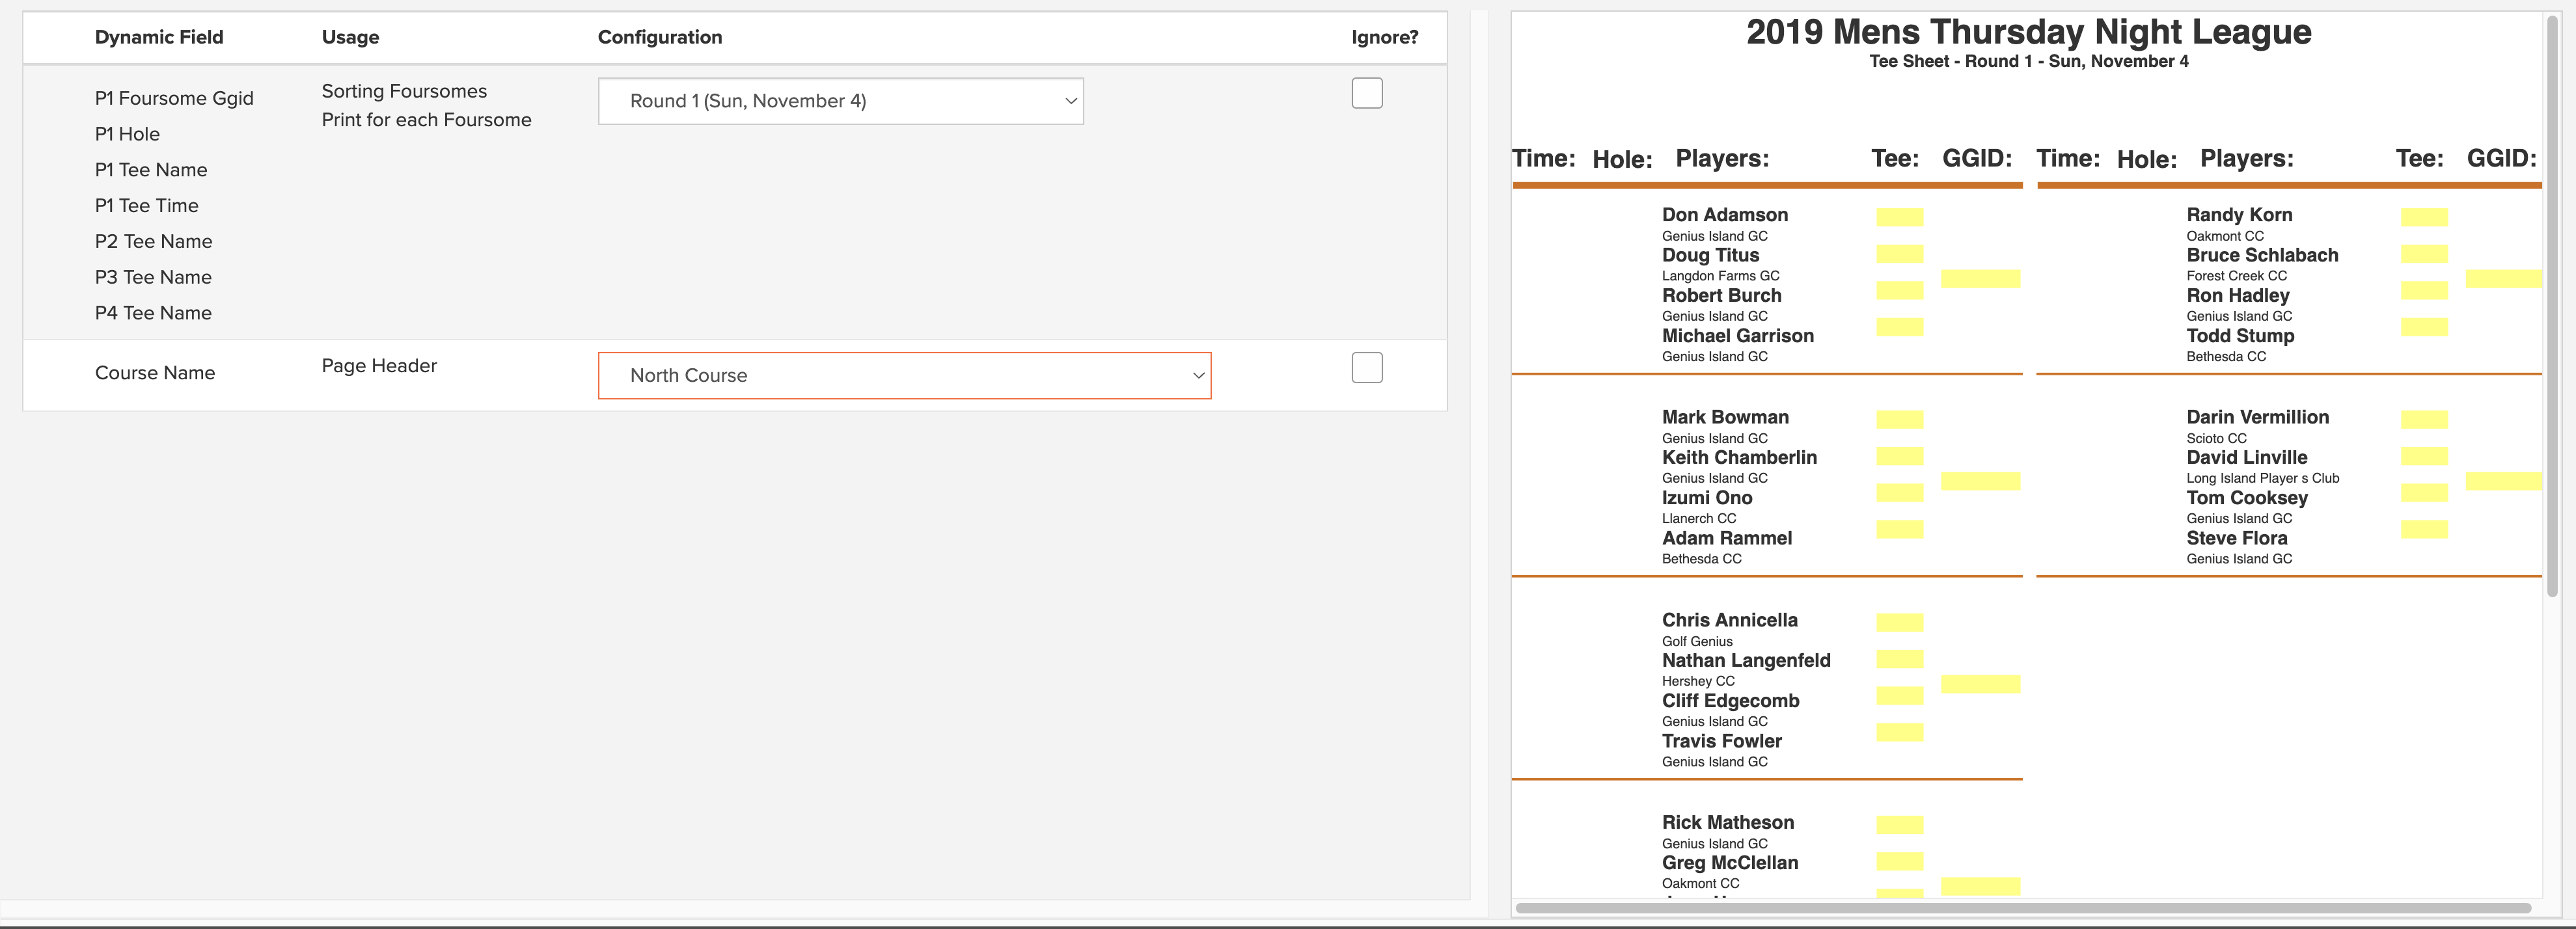
Dynamic data fields are used in all of the reports. They will change depending on the round, course, tournament, or tee. For instance, tee times are dynamic fields and change for players round to round. So it is important to select which round(s) will be used when creating the report. For example, if you made a report in round 1 but also want to use it in round 2, configure the report for round 1, select round 1 dynamic field, and then configure it to be used in round 2.
Scores are another example of a dynamic field. Player and team scores change, depending on the tournament. Maybe you would like to create a report that displays each player's Round 1 score next to their name. In that case, you will need to select the round and tournament to configure the report.